2024–2025 · NACO, a company of Royal HaskoningDHV
NetZeroTool
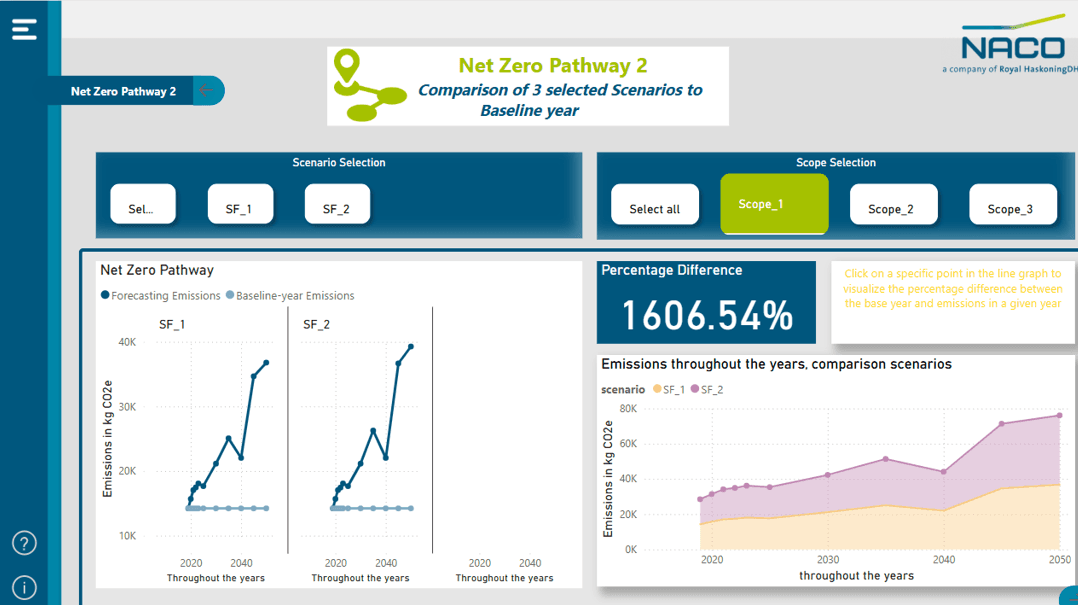
A dashboard that measures how long it takes an airport to reach net zero, fed with real Schiphol data.
2050
The date the tool puts on the baseline scenario. Every intervention an airport considers moves that date, and the dashboard shows by how much.
Emissions in kg CO₂e throughout the years, baseline against two reduction scenarios
The challenge
How do airports become aware of their CO₂ emissions and their sustainable energy use? The data existed, spread across sources, and nobody could say what it meant for a net zero date.
I designed a dashboard that measures how much time it takes to reach net zero, fed with real data from Schiphol.
Net zero is the point where CO₂ put into the air is balanced by CO₂ taken back out.
A date that far out only means something if you can see the gap today. That is the job of the tool.

Approach
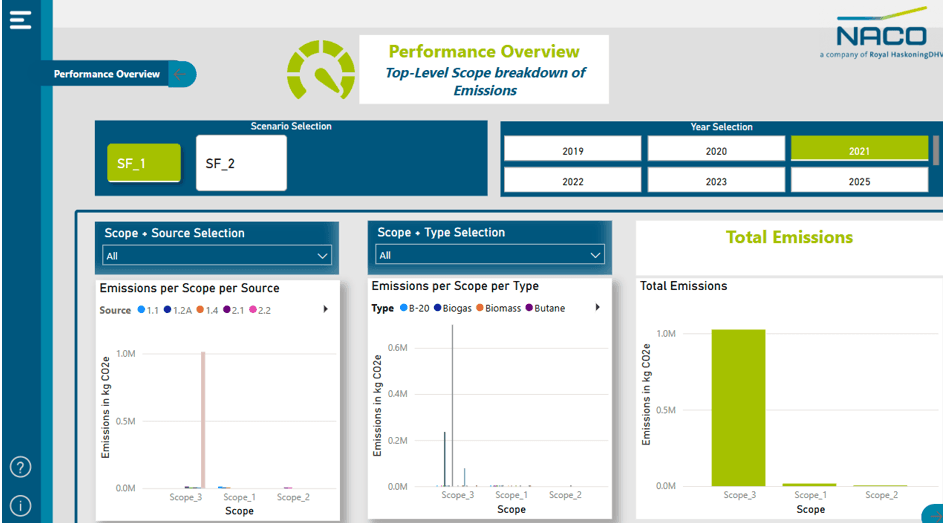
- 01Data translationEmission sources, scopes and energy use mapped into one model an airport team recognises.
- 02Dashboard designScenario and scope selection first, then the pathway, then the detail behind it.
- 03InteractionClick any point in the pathway to read the percentage difference against the baseline year.
My role
Dashboard design, data translation and interaction
I designed the dashboard, translated the emission data into something an airport team can act on, and defined the interaction between scenario selection, scope selection and the pathway views.
Result
Airport teams now compare scenarios side by side in one screen instead of arguing over separate spreadsheets. Planning conversations start from a shared number and a shared date.